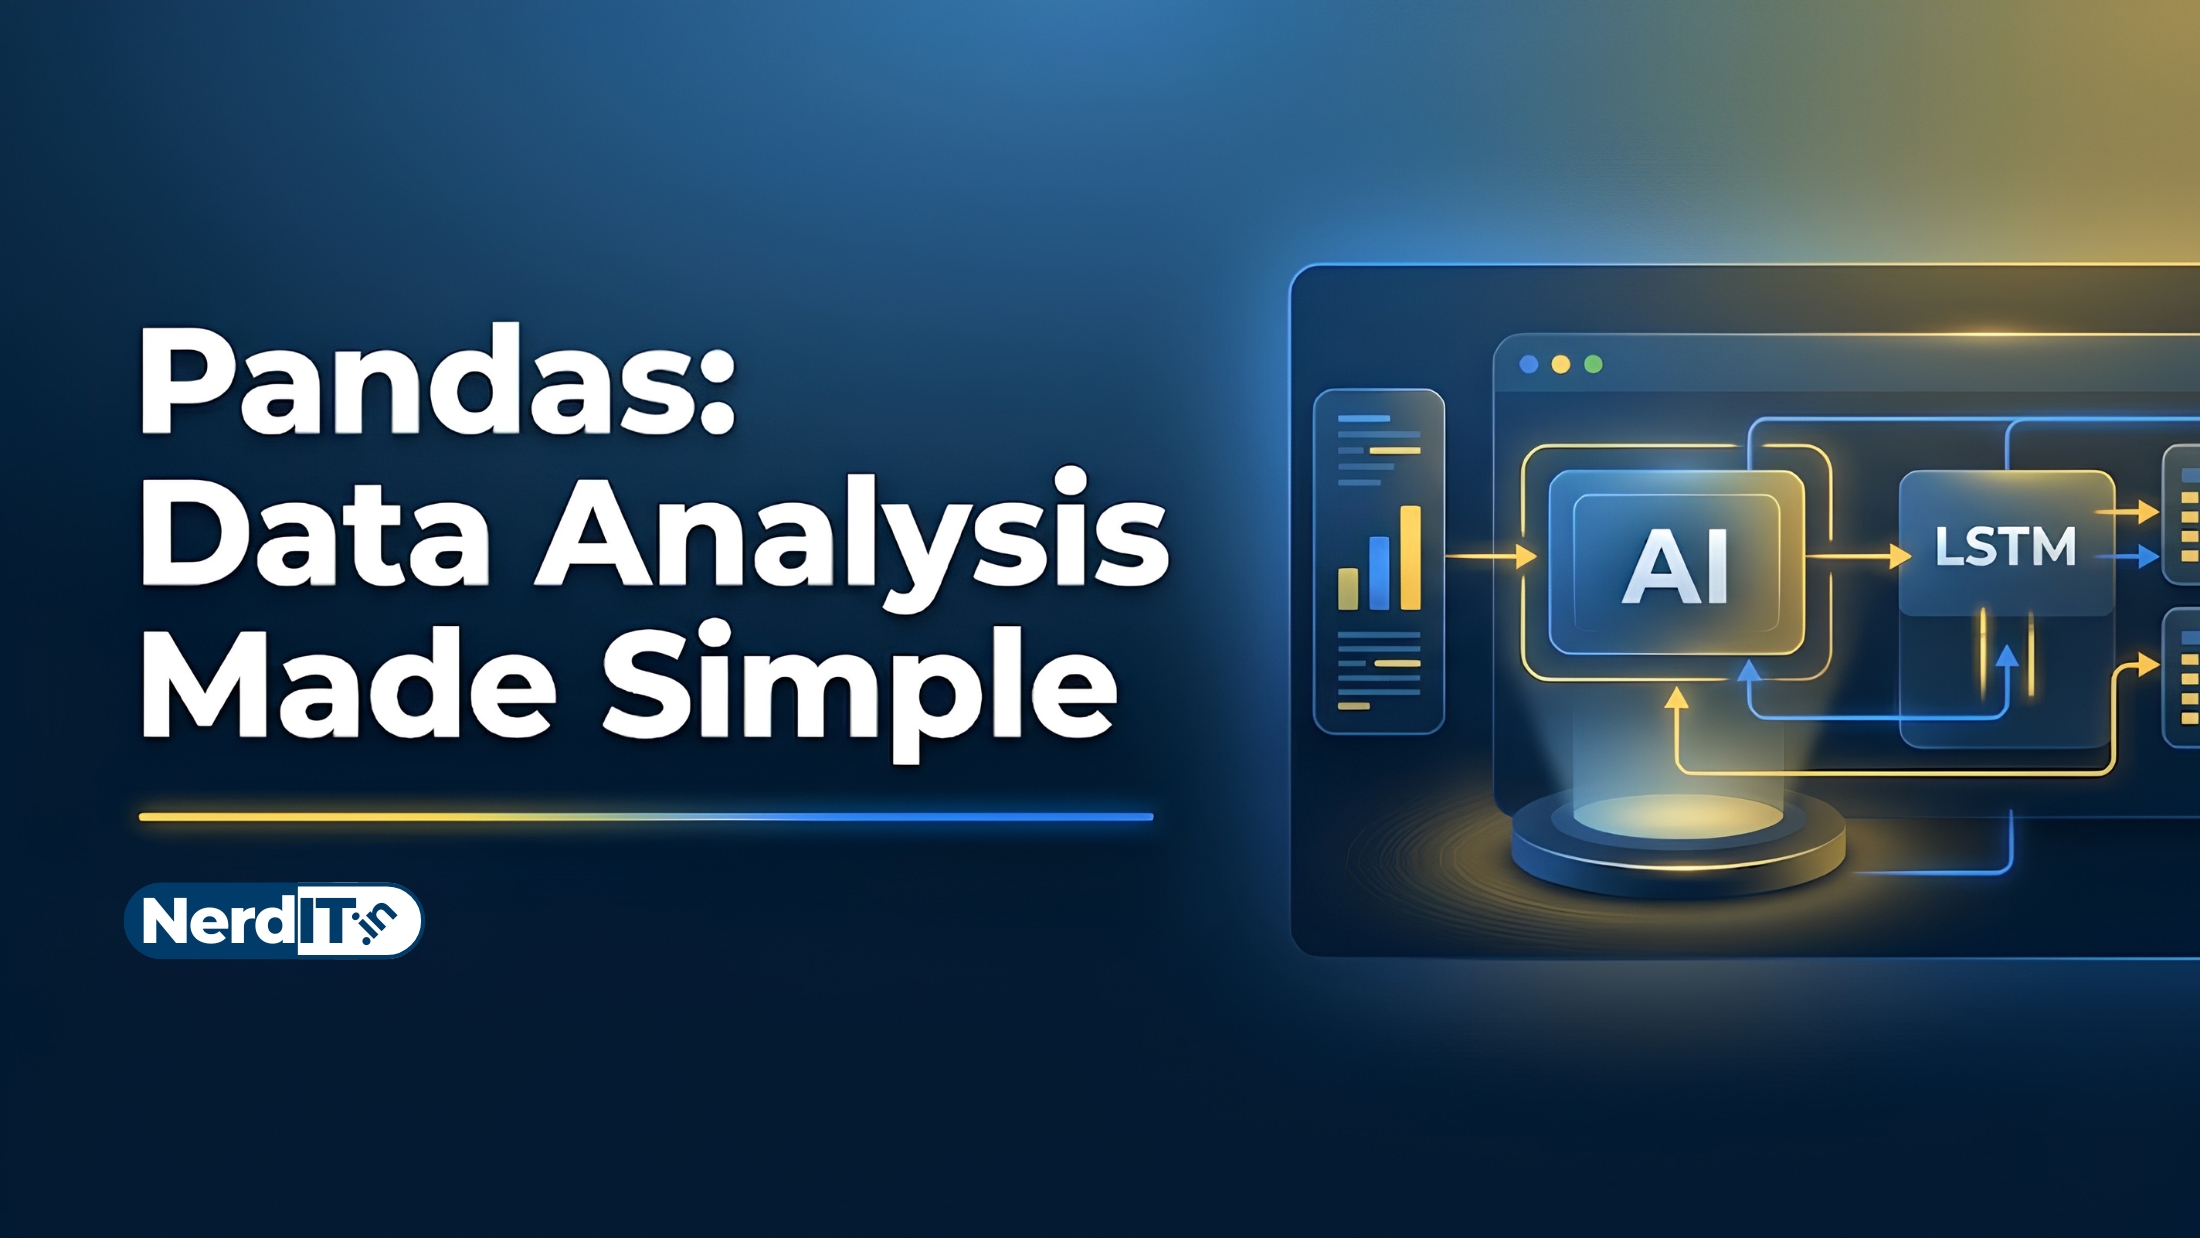
Pandas: Data Analysis Made Simple
Pandas is a powerful Python library used for data manipulation and analysis. It provides flexible data structures like DataFrames, enabling efficient cleaning, transformation, and exploration of structured data.
What's Included
20
Lessons
5h 24m
Duration
Certificate
What You'll Master
Skills and outcomes you'll walk away with
Advanced Data Analysis Techniques
Dashboard Reporting and Analytics Projects
Data Cleaning and Preprocessing
Data Inspection and Exploration
Data Transformation and Manipulation
Data Visualization with Pandas
Course Curriculum
20 lessons • 5h 24m total
Advanced Data Analysis Techniques
Dashboard Reporting and Analytics Projects
Data Cleaning and Preprocessing
Data Inspection and Exploration
Data Transformation and Manipulation
Data Visualization with Pandas
Expert-Level Pandas and Data Engineering
GroupBy and Aggregation Techniques
Indexing, Filtering, and Selection
Installing and Configuring Pandas
Introduction to Pandas
Loading and Exporting Data
Machine Learning Data Preparation
Mathematical and Statistical Analysis
Pandas with NumPy and Data Science Tools
Performance Optimization and Memory Management
Python Foundations for Pandas
Real-World Business and AI Applications
Understanding Series and DataFrames
Working with Time Series Data
Certification Path
Certification Exam
60 multiple-choice questions • 70% passing score required
Final Project: Comprehensive Real-World Data Analysis with Pandas
The objective of this final project is to demonstrate your proficiency in using the Pandas library for the entire data analysis lifecycle. You are required to select a real-world dataset (e.g., from Kaggle, UCI Machine Learning Repository, or a public API) and perform the following tasks in a Jupyter Notebook: 1. Data Acquisition: Load your chosen dataset into a Pandas DataFrame from a CSV, Excel, or JSON source. 2. Initial Inspection: Use functions like .head(), .info(), and .describe() to understand the structure and summary statistics. 3. Data Cleaning: Handle missing values appropriately (dropping or filling), remove duplicate rows, and ensure all columns have the correct data types for analysis. 4. Data Manipulation: Perform complex data operations including filtering rows based on specific conditions, sorting data, and creating at least two new derived columns (Feature Engineering). 5. Grouping and Aggregation: Use the .groupby() method or pivot tables to aggregate data and extract meaningful summary insights. 6. Data Visualization: Create at least three distinct visualizations (e.g., bar charts, histograms, or line plots) using Pandas built-in plotting or Seaborn to illustrate your findings. 7. Summary: Provide a brief written conclusion in a Markdown cell explaining the key insights discovered during your analysis.
Verified Certificate
Earn a verified PDF certificate with unique verification ID upon completion • ₹299
Related Courses
More free AI & Data Science courses with verified certificates
 Mastering Linear Regression: Theory & ImplementationBeginner
 Mastering Random Forest AlgorithmsIntermediate
 Mastering Seaborn for Statistical Data VisualizationIntermediate
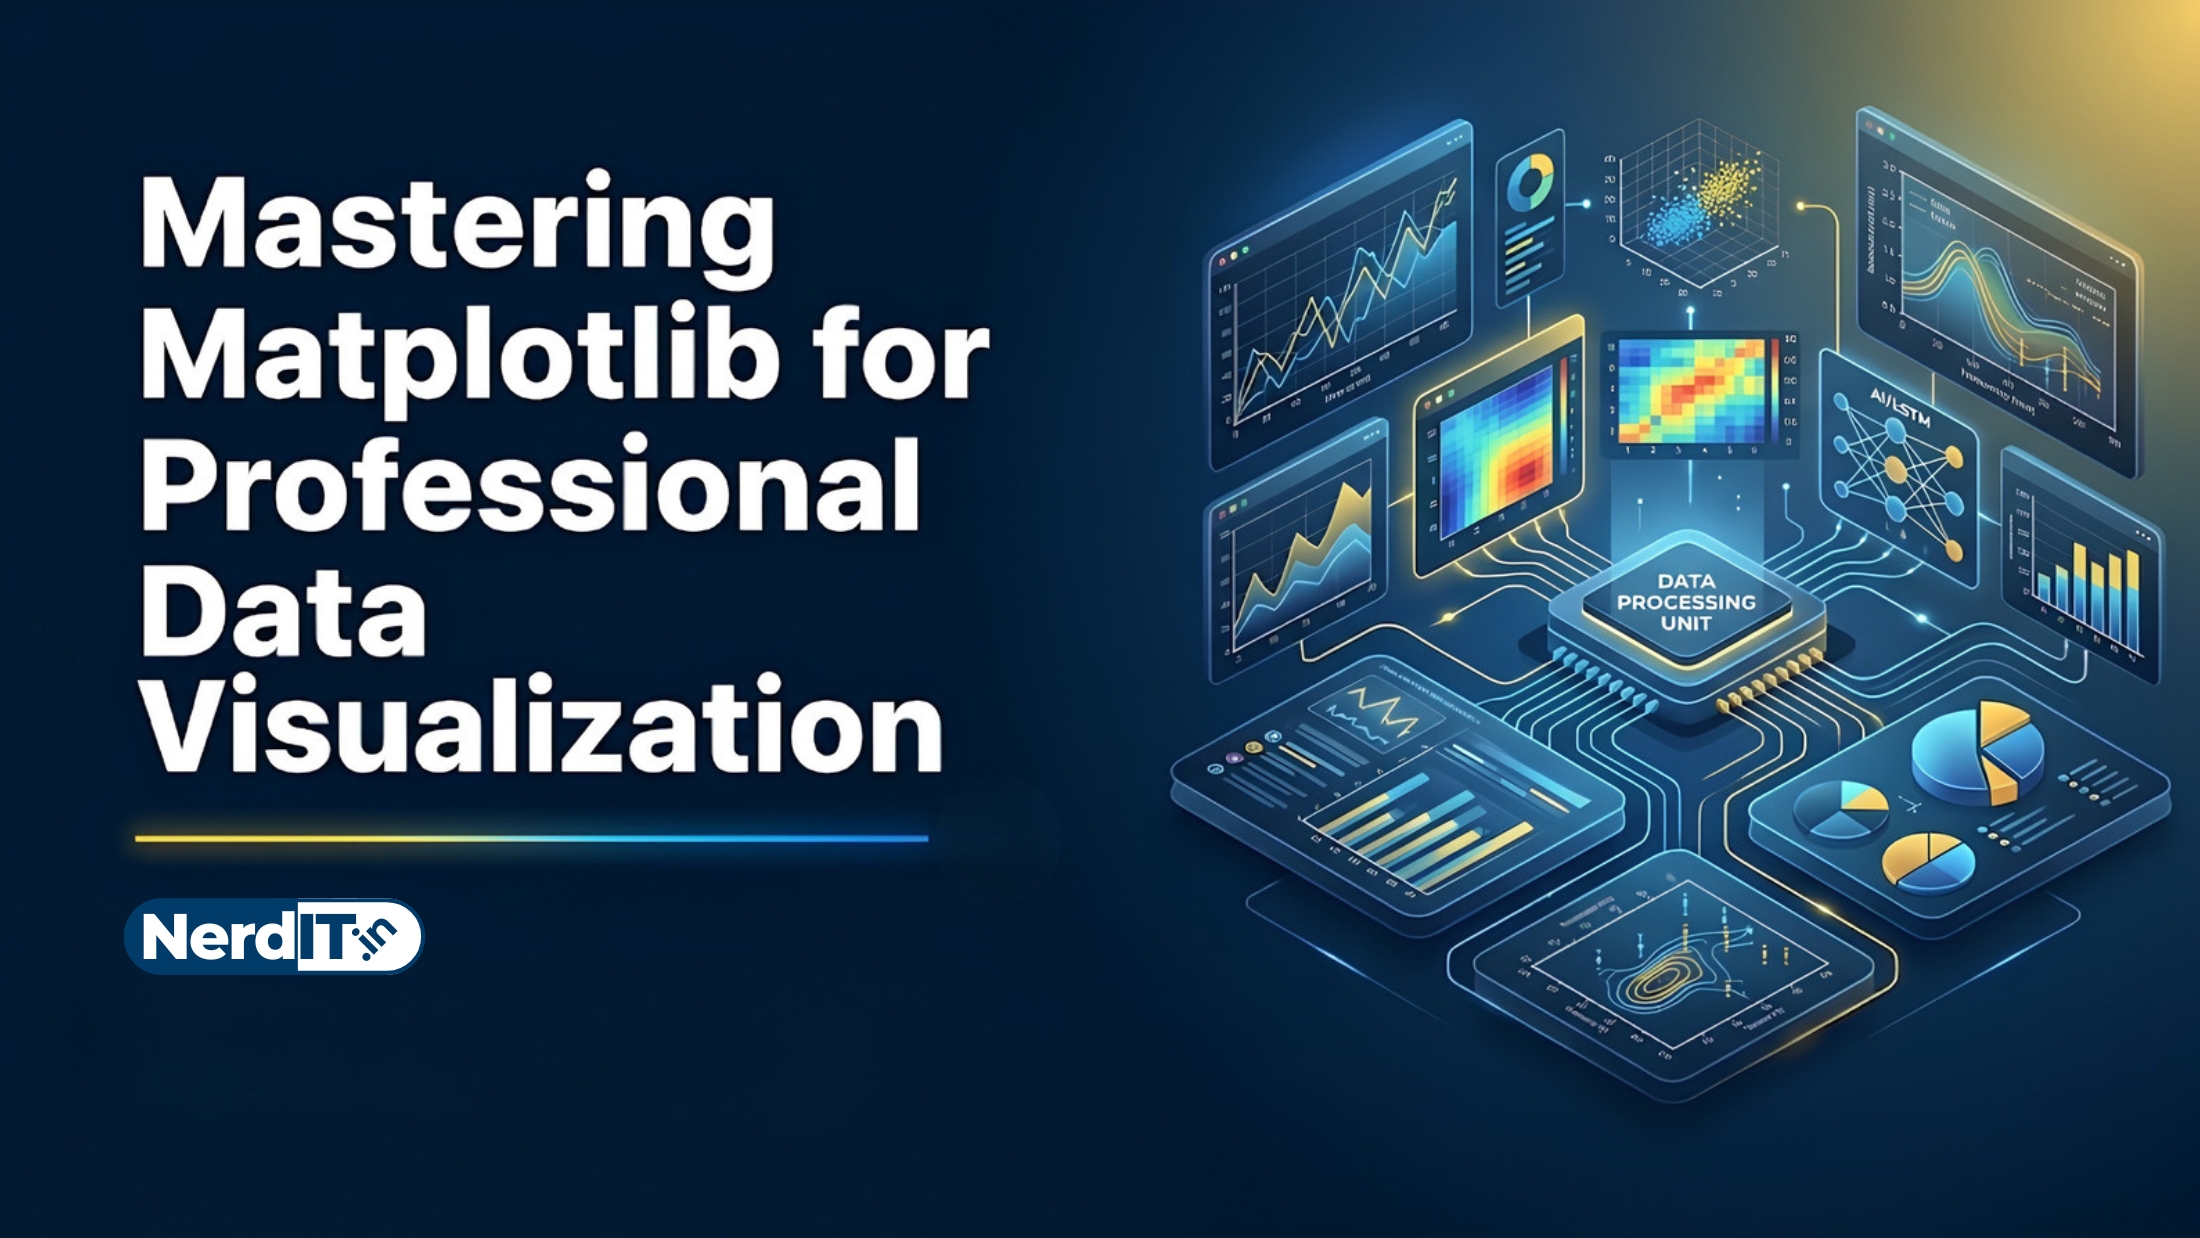 Mastering Matplotlib for Professional Data VisualizationIntermediate
Reviews & Ratings
No reviews yet — be the first!
Free
Free course — learn at your own pace
Certificate: ₹299
Verified Certificate
₹299 — pay only to certify
- Unique verification ID — provably genuine
- Shareable & ready for your LinkedIn profile
- Verifiable by anyone, anytime on our verify page
- Learn 100% free — the certificate is optional